
First and foremost: PERFORMANCE
Even higher
productivity
Key challenges
- Analysis of historical downtime data for individual machines.
- Accurate representation of line operation, including failures of individual machines.
- Determining the buffer location (between which stations) and buffer size.
The goal was to determine the optimal buffer size.
In production lines characterized by high variability, a properly selected buffer size can have a significant impact on productivity. This is an issue that is very difficult to solve using tools such as Excel. When working with average values of machine availability percentages, the ability to accurately analyze the problem is lost.

We always strive for the goal
Results of our work
Optimization
The optimal buffer location and size were determined.
Higher productivity
The proposed changes resulted in an increase in line productivity of approximately 4.4%.
Reliable analysis
Simulation supported informed decision-making based on reliable analysis.
know how. Fit for the 21st century.
How did we achieve the objectives?
Start of cooperation
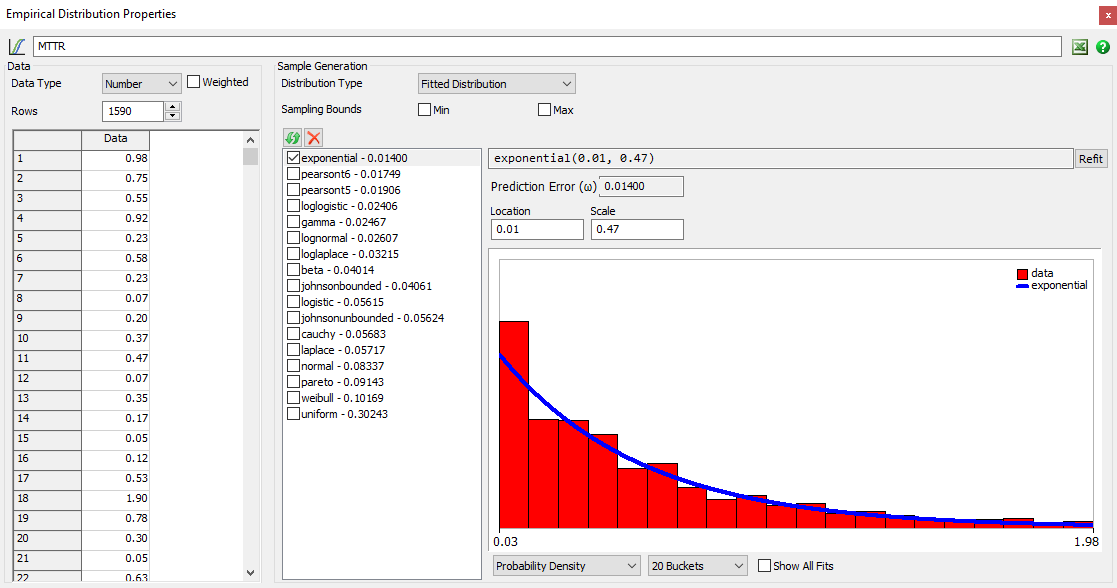
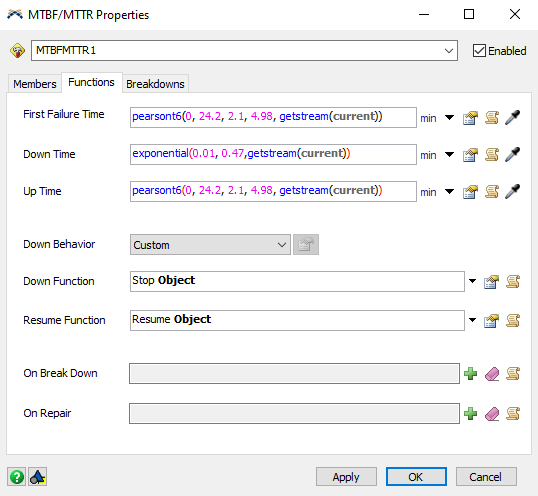
As in every simulation project, the first step was the analysis of data provided by the client. In this case, based on historical data, distributions of MTBF (Mean Time Between Failures) and MTTR (Mean Time To Repair) were determined. These took the form of stochastic distribution, where fitting was possible, or empirical distributions. These tasks were carried out using tools available in the FlexSim software.
Building the model in FlexSim software
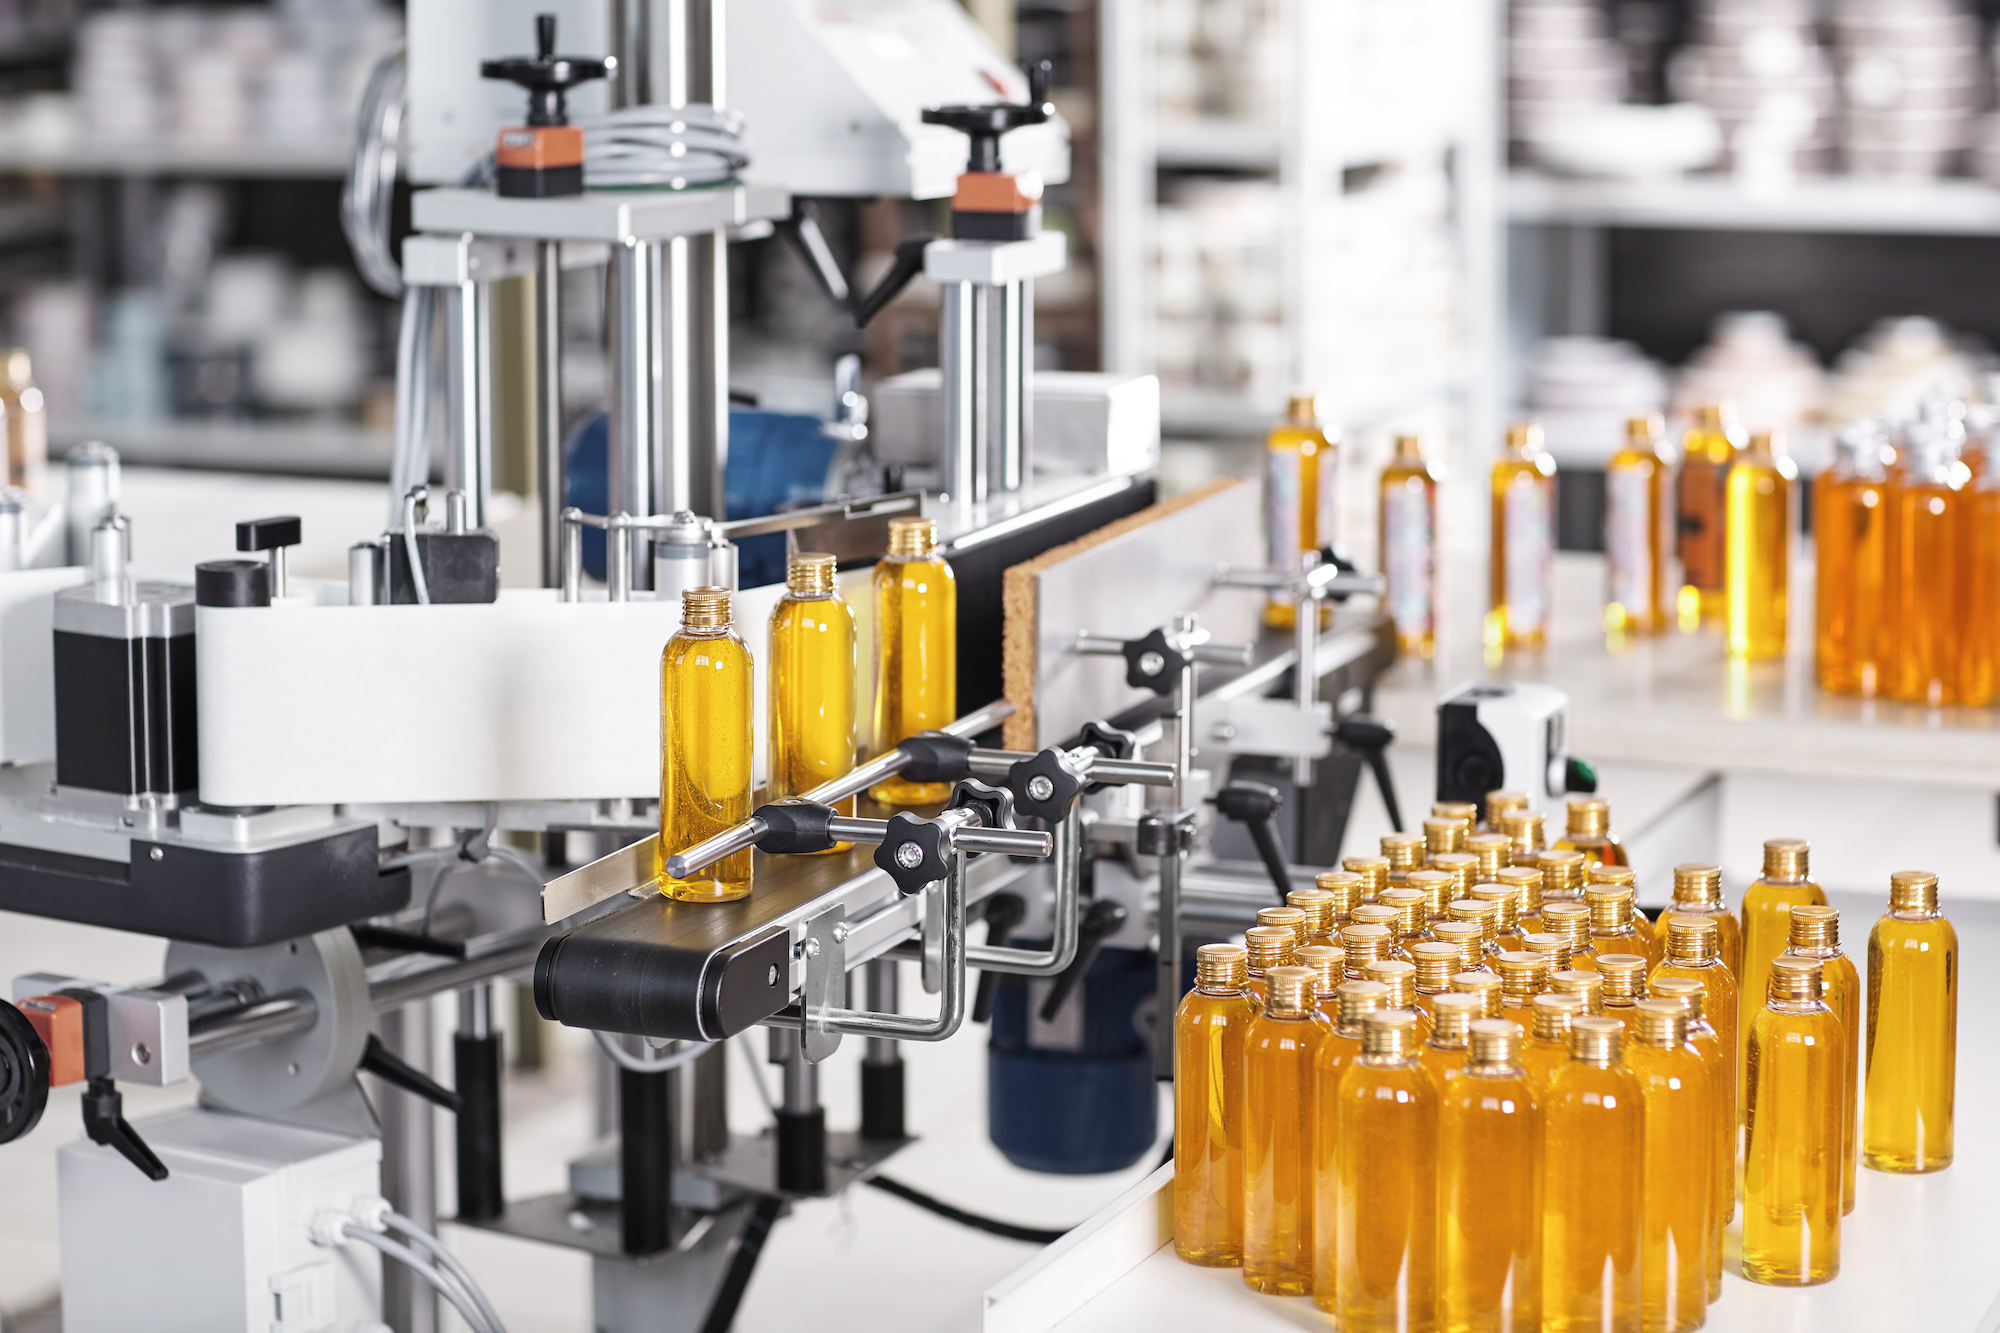
The next step was model development. The analyzed line was automated, with transport between individual stations carried out using conveyors.
Based on the line layout (DWG file) and machine parameters, a model was built in FlexSim. Particular attention was paid to cycle times, product movement speeds, and buffer sizes. The previously created distributions were used to accurately represent the operation of individual workstations.
Implementation
What decision did the client make?
After positive verification and validation of the simulation model (comparing real line results with those obtained from FlexSim simulation), the core phase of the analysis began—experimentation. Numerous scenarios were tested, covering different buffer locations and buffer sizes. Simulation was used here as a WHAT IF analysis tool—for example: What will happen if we place a 200-piece buffer between these machines—how will this affect line performance?
For each possible decision regarding changes to the line, KPI values could be calculated. FlexSim helped process owners make the best decision regarding production line expansion.